
Background on Technical Assessments
Right now I am currently in the throes of recruiting for Data Scientist positions as I approach graduation from my master’s program at Northwestern. For those unfamiliar, a typical recruiting process will start with the traditional screener from an HR recruiter, progress to a conversation with the hiring manager, include a technical assessment and finish with an on-site visit. The unusual piece is the technical assessment, although this is not outside the norm for developers or software engineers. These technical assessments can really run the gamut: some are timed, some are not timed, some have specific questions, some have vague instructions, some use company data, some use publically available data, some are 2 hours, and some are several days. Technical assessments are fun and challenging, but can also be a pain.
I was interviewing with a software company and was presented with the following technical assessment. I think this company was on point with the structure: 2 hours of work, untimed, a 3 day window, with real company data. My wife gets a little peeved with companies have use real data - she thinks that the work I (and other applicants) do should not be used by the company. Personally, I prefer real company data and questions as it is a good taste of the actual work I might be doing. Plus it makes the assessment more than a theoretical exercise. For this post, I am sharing my work on the companies data. Data protection and client privacy are important these days so I have sterilized the data (removed all identifying features and adding random noise) as a professional courtesy to the company.
Ultimately, I did not get the position, which was really disappointing to me. I was quite excited about the role and company. Nevertheless, I learned from the challenge and had some fun in the process. Let me know what you think of the work. Feedback is appreciated.
The Questions
I was expected to answer the following questions, doing my own work (naturally) but with any resource available, using any software system of my choice, spending 2 hours of time. Truth be told, I spent more like 5 hours initially. For one thing, the hiring manager said 2-4 and I really liked the company and role. The data challenge was also intriguing to me. I was to send the response in an email format with accompanying visuals and code within 3 days. The company offers a software with a freemium version and a paid subscription. To access certain features you need to pay the subscription. If you are using the freeium version and you try to access one of those features, you will hit a “paywall” which will prompt you to pay for access.
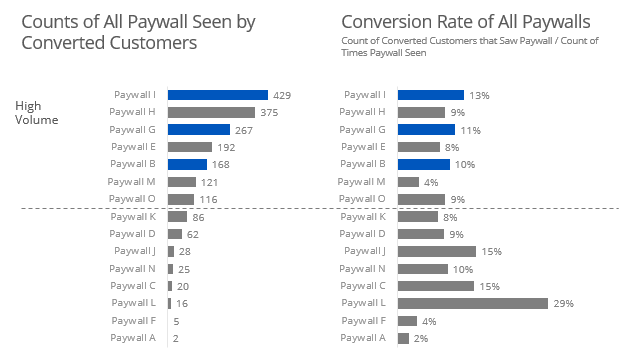
- Which paywalls have the best conversion rate?
- Which paywalls contribute the most revenue?
- Recommendations?
Immediately, it looks like this is an attribution problem. Since users can hit more than one paywall before paying, how do I decide whether or not each paywall is responsible for conversion or revenue? Attribution is not a problem unique to this company. It is every company’s problem. In fact, this is the second data challenge I’ve seen dealing with attribution.
The data came in two files and looked pretty straight-forward - users with a date if and when they hit each paywall and users with their first payment date and value. Using R, loaded in the data, joined the files and converted the dates using my favorite tidyverse packages.
# Libraries
library(tidyverse)
library(lubridate)

# Data
paywall <- read_csv("paywall_data.csv") %>%
  mutate_at(3:18, mdy_hm) %>%
  inner_join(read_csv("paywall_payment_data.csv"), by = "id") %>%
  mutate(`First Payment Date` = mdy_hm(`First Payment Date`))
| id | Paid? | Registration Date | Paywall A | Paywall B | … | Paywall O | First Payment Date | First Payment Value |
|---|---|---|---|---|---|---|---|---|
| 1651668 | 0 | 3/10/2013 2:22 | NA | 3/10/2013 19:39 | … | NA | NA | |
| 1651651 | 1 | 2/17/2013 18:23 | NA | 2/17/2013 19:39 | … | NA | 2/18/2016 18:23 | $10 |
| 6519846 | 1 | 1/27/2013 8:30 | 1/28/2013 22:39 | NA | … | 1/28/2013 12:39 | 1/28/2013 8:30 | $50 |
Exploratory Analysis
Generally my process, engrained in me from my days in management consulting, is to storyboard out the final presentation and then work backwards into each figure. I always have blank white paper by me with scribbled mock-ups including the takeaway and corresponding graph. This helps me stay on schedule and focused on the task at hand.
Every project begins with exploratory analysis. Easy to skimp on, especially with only a 2-4 task, but absolutely critical. Keep in mind, I am not showing all my code - only that which proved to be interesting. Many of my graphs I created in R first and then recreated in PowerPoint and Excel for more visual control.
# Distribution of Subscribers
table(paywall$`Paid?`)

# Distribution of First Payments
as.data.frame(table(as_date(paywall$`First Payment Date`)))
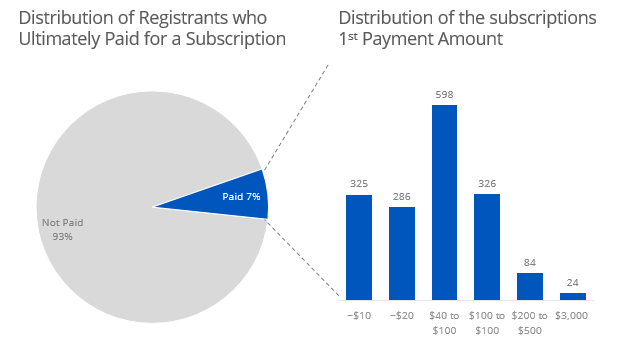
I am glad that I did the exploratory analysis because the data was really sparse before 2013. I would not have caught that otherwise.
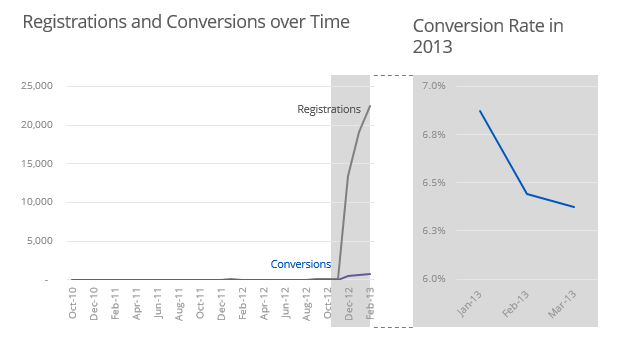
# Conversion rates
paywall %>%
  group_by(year(`Registration Date`), month(`Registration Date`)) %>%
  summarise(Registrations = n(),
            Converstions = sum(`Paid?`),
            Converstion_rate = Converstions/Registrations)

# Filtering for 2013 only
paywall <- paywall %>%
  filter(`Registration Date` >= as_date("2013-01-01"))
However, I did miss one important aspect of the data - some paywalls are seen after the user pays for a subscription. There are different levels of subscription. I know this because the hiring manager sent back some follow-up questions. With any experience in the company I am sure I would have known that this was the case, so it is a little bit nit-picky. If I did not get the position just for this reason, I would be a little salty. Nevertheless, the onus is on me to examine the data - I took it at face value and made assumptions. After the follow-up email, I adjusted my code and recreated the slide deck. I am sure there is a more elegant way to do this in R. I conducted lots of testing to ensure this worked.
# Removing paywalls after the first payment date
paywall <- paywall %>%
  mutate(temp_date = ifelse(is.na(`First Payment Date`), ymd_hm("2999-01-01 02:22"), `First Payment Date`)) %>%
  mutate(temp_date = as.POSIXct(temp_date, tz = "UTC", origin = "1970-01-01"))
paywall <- paywall %>%
  mutate_at(4:18, function(.){ifelse(. >= paywall$temp_date, NA, .)}) %>%
  mutate_at(4:18, function(.){as.POSIXct(., tz = "UTC", origin = "1970-01-01")}) %>%
  select(-temp_date)

# Removing paywalls before the registration date
paywall <- paywall %>%
  mutate(temp_date = ifelse(is.na(`Registration Date`), ymd_hm("1900-01-01 02:22"), `Registration Date`)) %>%
  mutate(temp_date = as.POSIXct(temp_date, tz = "UTC", origin = "1970-01-01"))
paywall <- paywall %>%
  mutate_at(4:18, function(.){ifelse(. <= paywall$temp_date, NA, .)}) %>%
  mutate_at(4:18, function(.){as.POSIXct(., tz = "UTC", origin = "1970-01-01")}) %>%
  select(-temp_date)
Conversion Rates
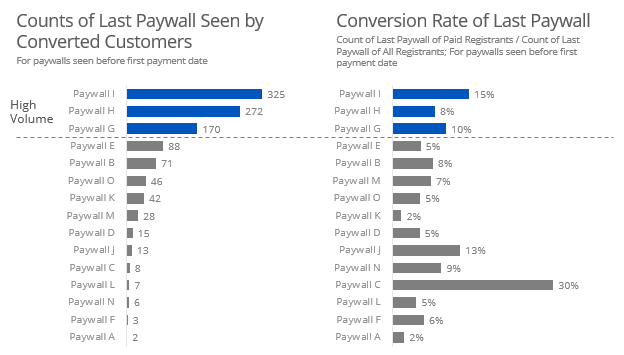
The first question is about conversion rates of different paywalls. Now the cool thing for me as a Data Scientist would be to jump in immediately to the fun, complicated advanced methods - I think that would be more impressive as well. However, I take the philosophy of start simple and build up to more complicated. So the most naive approach would be to just assume the last paywall is responsible for the conversion - the “last paywall wins” approach. It’s simple and makes lots of questionable assumptions, but it is quick.
  # Last Paywall Wins
paywall %>%
  select(1:2,4:18) %>% # Selecting the paywall variables
  gather(paywall,date,3:17) %>% # Makeing the data 'tidy'
  arrange(id) %>%
  group_by(id) %>%
  filter(date == max(date, na.rm = TRUE)) %>% # gettin the max paywall by date
  group_by(paywall) %>%
  summarise(cnt = n(),
            converted = sum(`Paid?`),
            converstion_rate = converted/cnt) %>%
  arrange(desc(cnt))
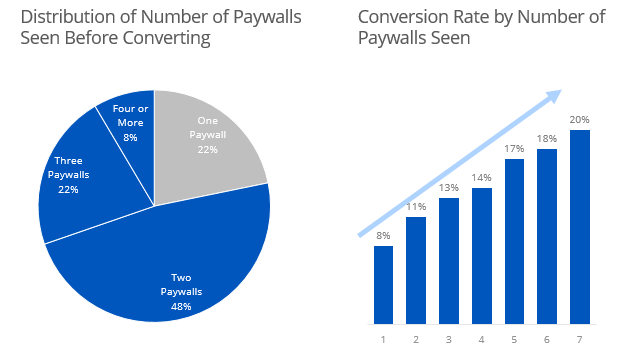
Naturally, there are better ways so I put in an explanation slide. The following code was used to calculate the figures used in the graphs.
# All Customers
paywall_vert %>%
  filter(!is.na(date)) %>%
  group_by(id) %>%
  summarise(cnt_paywalls = n()) %>%
  group_by(cnt_paywalls) %>%
  summarise(dist = n())

# Converted Customers
paywall_vert %>%
  filter(!is.na(date),
         `Paid?` == 1) %>%
  group_by(id) %>%
  summarise(cnt_paywalls = n()) %>%
  group_by(cnt_paywalls) %>%
  summarise(dist = n())
Perhaps equally as naive is to use every paywalls ever seen in the conversion rate - the “every paywall seen” method.
  paywall %>%
  select(1:2,4:18) %>%
  gather(paywall,date,3:17) %>%
  arrange(id) %>%
  filter(!is.na(date)) %>%
  group_by(paywall) %>%
  summarise(cnt = n(),
            converted = sum(`Paid?`),
            not_converted = cnt - converted,
            converstion_rate = converted/cnt) %>%
  arrange(desc(converted))
Ultimately, there are a lots of factors that go into whether or not a customer converts: the order of the paywalls, the combination of paywalls, the time since registration before first/last paywall, etc. This is where a predictive model would really shine. However, remember my time is limited so I just did a predictive model on whether each paywall was seen.
library(rpart)
library(rpart.plot)

paywall_dt <- paywall %>%
  select(2,4:18) %>%
  mutate_at(2:16, function(.){factor(!is.na(.), levels=c("TRUE","FALSE"))}) %>%
  mutate(`Paid?` = ifelse(`Paid?`==1,"Paid","Not"))

# Grow a tree
control <- rpart.control(minbucket = 5, cp = 0.0001, maxsurrogate = 0, usesurrogate = 0, xval = 3) # Tuning parameters
fit1 <- rpart(`Paid?` ~ ., paywall_dt, method="class", control = control) # model fit

# results of tree
printcp(fit1) # display the results
plotcp(fit1) # visualize cross-validation results

# prune the tree
fit1<- prune(fit1, cp = 0.00010336) # Prune to minimum xerror or something close

# plot tree
rpart.plot(fit1, cex = .8)
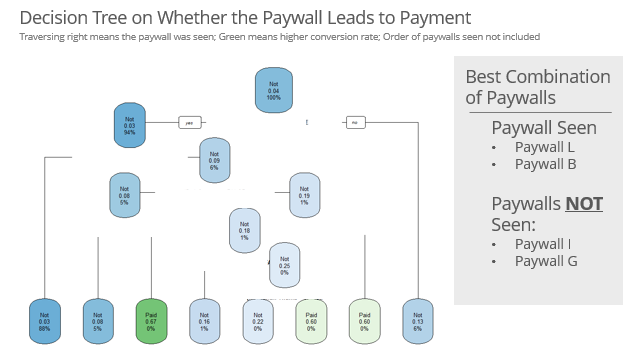
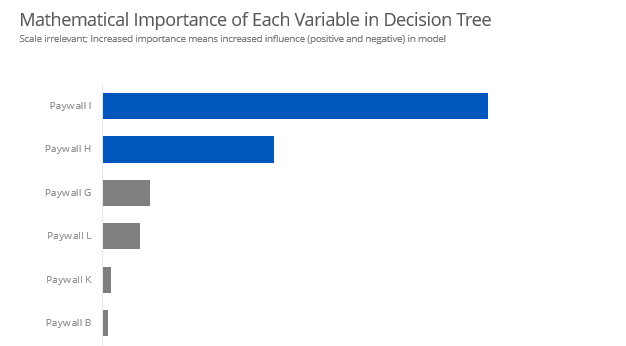
With decision trees, there is a way to mathematically assess each variables importance in the model. This makes for a nice graph. However, this does not necessarily tell us if the paywalls lead towards or away from conversion.
as.data.frame(fit1$variable.importance)
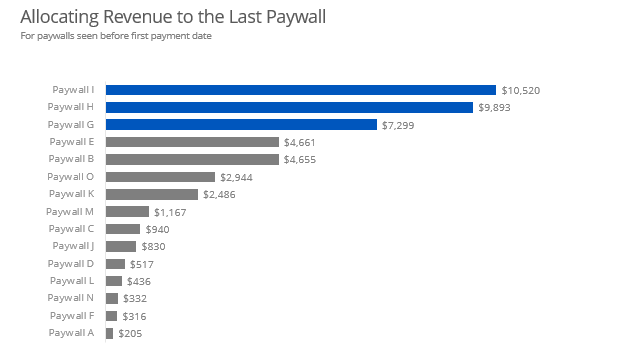
Revenue Attribution
As with the conversion rates, I like to build up to more complicated methods. Starting again with the “last paywall wins” method.
# Last Paywall Wins
paywall %>%
  filter(`Paid?` == 1) %>%
  select(1,4:18,20) %>%
  gather(paywall, date, 2:16) %>%
  filter(!is.na(date)) %>%
  group_by(id) %>%
  arrange(desc(date)) %>%
  top_n(1) %>%
  group_by(paywall) %>%
  summarise(rev = sum(`First Payment Value`))
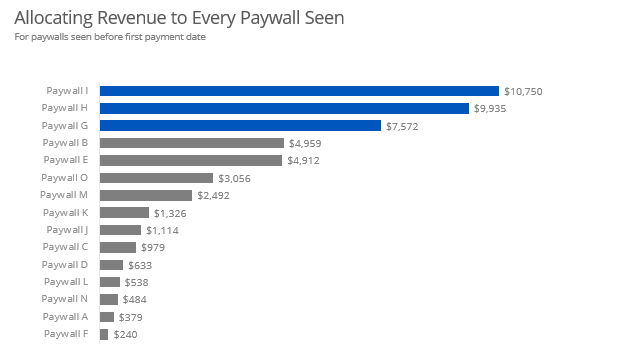
I followed my pattern with conversion rates with the “every paywall seen” method. In this case, each paywall gets equal amount of revenue.
# Equal Weighting
paid <- paywall %>%
  filter(`Paid?` == 1) %>%
  select(1,4:18,20) %>%
  mutate_at(2:16, function(.){!is.na(.)}) %>%
  mutate(paywalls_seen = rowSums(.[2:16]),
         rev_perc = `First Payment Value`/paywalls_seen) %>%
  gather(paywall,value,2:16) %>%
  filter(value == TRUE) %>%
  arrange(id) %>%
  group_by(paywall) %>%
  summarise(rev = sum(rev_perc))
Initially, this is all I dared submit in the 4-5 hours I worked on the project. But as I was later pondering on the problem, I thought about weighting each paywall by the time since the first payment. This way, if a user sees a paywall and ignores it for a week, that paywall will get a low amount of revenue. But if a user sees a paywall and then immediately pays, that paywall will get high amount of revenue.
# Calculating total trial duration
paid <- paywall %>%
  filter(`Paid?` == 1) %>%
  mutate(trial_duration_days = as.numeric(`First Payment Date` - `Registration Date`)/(60*60*24)) %>%
  filter(!is.na(`Registration Date`)) %>%
  mutate_at(4:18, function(.){. - paid$`Registration Date`}) %>%
  mutate_at(4:18, function(.){as.numeric(.)/(60*24)})

# Weighting by days since registraion in wide format
paid <- paid %>%
  mutate_at(4:18, function(.){. / paid$trial_duration_days})

# Calculating revenue attribution in wide format
paid <- paid %>%
  mutate(denom = rowSums(.[4:18], na.rm = TRUE)) # denominator
paid <- paid %>%
  mutate_at(4:18, function(.){. / paid$denom}) # weighting
paid <- paid %>%
  mutate_at(4:18, function(.){. * paid$`First Payment Value`}) #value

# Making the data 'tidy' and calculating revenue for each paywall
paid %>%
  select(1,4:18,20) %>%
  gather(paywall, rev, 2:16) %>%
  filter(!is.na(rev)) %>%
  group_by(paywall) %>%
  summarise(rev_att = sum(rev))
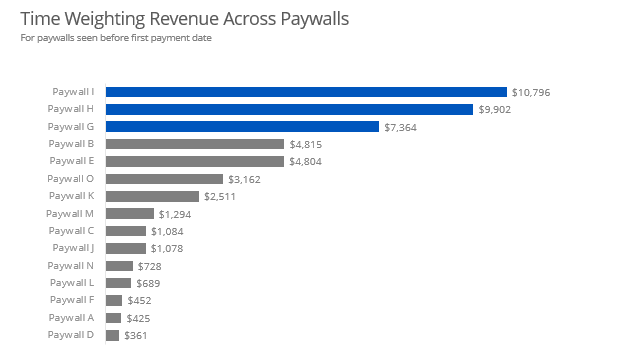
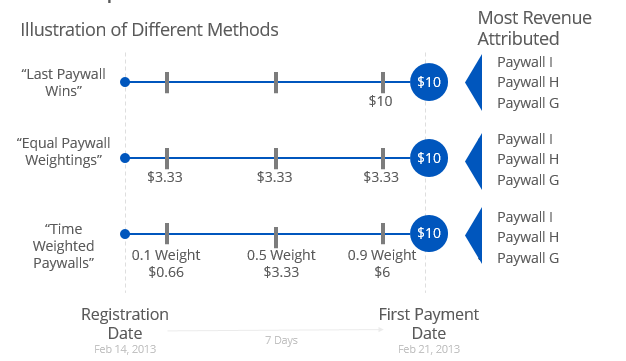
I added a slide to illustrate my methodology for the layman or executive team. What is nice is that all three method confirm each other. While the dollar amounts vary slightly, Paywall I contributes the most revenue followed by Paywall H and Paywall G. I think this a great data science work - three different methods all pointing in the same direction. The company should be excited about this.
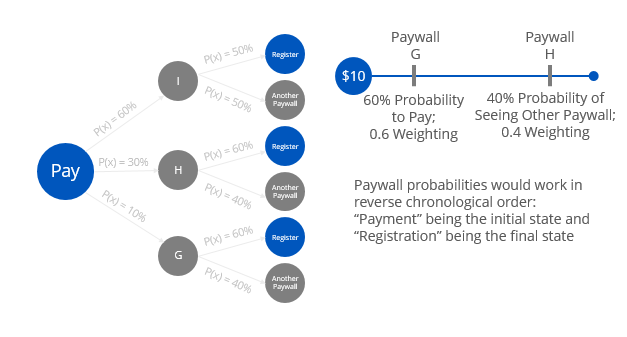
Now I wanted to show that I could also get into the sexy stuff as well. And one thing that is missing from each of the methods is the order in which paywalls are seen. I think Markov Chains could be quite useful here. Now I confused even myself thinking about it, but the essence of the idea is you could use the probabilities of moving to the difference in a weighting formula.
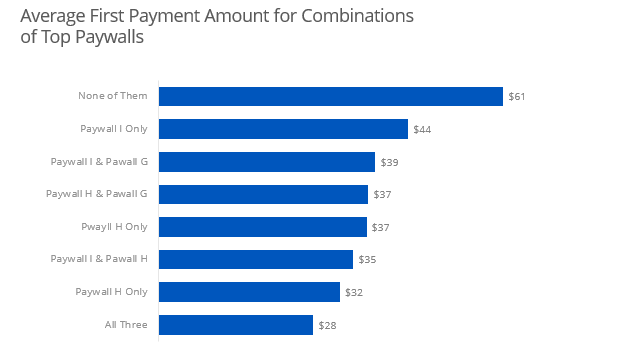
Also, I wanted to think about the expected revenue of different combinations of paywalls. Perhaps I could get into some association rules. If Paywall A and Paywall B is seen then the expected revenue is $X - but if Paywall A, B and C are seen the expected revenue is $Y. And the probability of seeing Paywall C given Paywalls A and B is 0.2. Therefore, Paywall C revenue is something like $Y-$X - ($Y-$X)*0.2.
Conclusion and Takeaways
- For the conversion rates, Paywalls I, H, and G are your heavy hitters. However, all paywalls seem to have very similar rates. Nothing really pops out in the data to me here. A predictive classification model is would really be ideal here.
- For revenue attribution, Paywalls I, H, and G are your power walls. Three different methods confirm this.
- Recommendations include using Markov Chains, Association Rules to further explore revenue attribution, especially if combinations of paywalls is of interest. Expanding predictive model features and possibly even doing some cluster analysis to see behavior patterns on conversion rates. Lastly, perhaps consider “soft” paywalls that user can pass through temporarily.
Outcome
So that’s my analysis. The full slides are here. The company, which I really admire and had an excellent recruiting process, responded to me quickly - the next business day. Unfortunately, it was in the negative. I really feel I put my best foot forward so I am not really ashamed, but I am disappointed with the outcome. In my biased opinion, my experience and cultural fit was quite excellent. I aligned quite well with the role. Naturally, I have been analyzing every aspect of the process with my wife. Perhaps they wanted me to ask more questions via email, perhaps they wanted a silver-bullet solution, perhaps they wanted a more simple solution, perhaps I came on too strong, perhaps it’s because I didn’t catch the post-payment paywalls. Or perhaps it was something completely outside my control.
At any rate, I would love to hear what you think. Is this useful analysis to your business? Are there alternative ways to measuring attribution? How do mutate_at() work? Hit me up in the comments.