Select Projects From Northwestern
Data Cleansing Algorithm
During the required summer internship, I was privileged to be hired by GE Transportation. GE is renown for it's industrial data science and connected machines platform, Predix. I worked with a team of data scientists on locomotives.
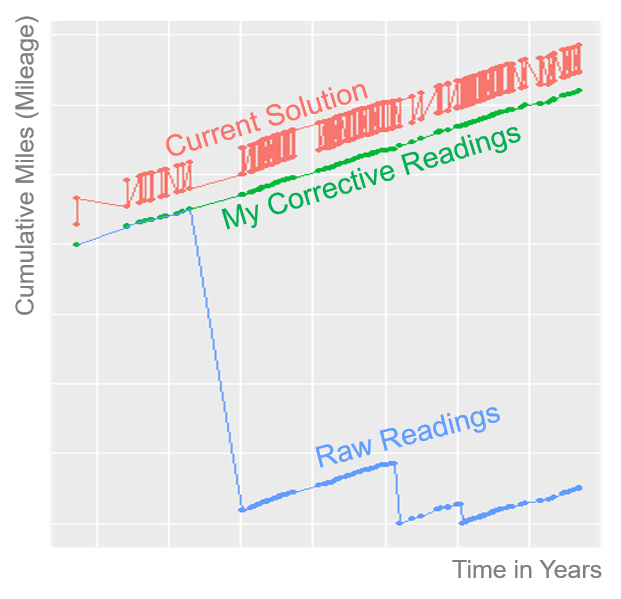
Accurate odometer readings are very important. Not only are odometer reading readings used to schedule regular maintenance, but mileage is also highly predictive of locomotive parts failure. Unfortunately, the odometer readings, along with other sensors, have many data quality issues resulting in widespread distrust.
There were several piecemeal solutions for the bad sensor data. My goal was to create an elegant solution that can be generalized to all sensor problems. I iteratively predicted where the next reading should be using localized regression (LOESS). If the reading fell outside of a confidence interval, all future points were adjusted. I ran a simulation on 5,000 random locomotives. My algorithm was 250x better than the current solution, erroring only 0.01% of the time. I then worked with DBAs to implement my method and spoke with locomotive owners to build trust in the readings.
Predicting Auto Purchases
Allstate knows it’s core business of auto insurance will eventually be disrupted by the advent of self-driving cars. In preparation, it has funded a child company with a startup-like flair called Arity. Arity’s mission is to leverage Allstate’s strengths to generate new revenue streams.
With a team of three other Analytics students and four Kellogg MBAs, we won a competition to work with Arity. Our goal was to create a fully-functional, marketable and profitable B2B data product.
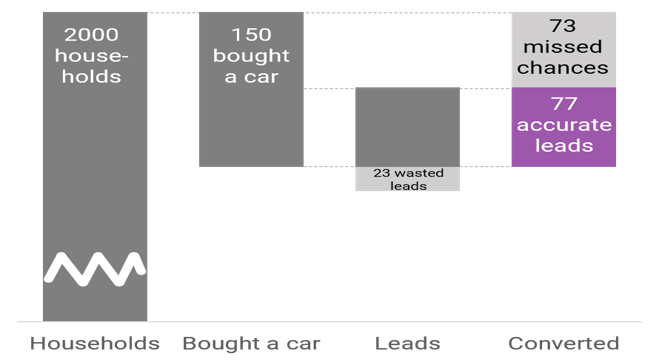
After exploring Allstate’s data, we proved that Allstate had incredible depth and breadth of data on their customers. We decided to create models answering the key questions every auto manufacturer and dealer would like to know: Who is going to purchase another vehicle in the next period? What vehicle will it be? How much are they willing to pay?
Following advanced feature engineering, we created three models to answer each question. Our models were created in R and Python and included logistic, neural nets and random forests. Some of our models were extraordinarily accurate at 70%-90%. When we concluded, preliminary sales agreements had been made with leading auto manufacturer.
Sketch Image Retrieval and Generator
Deep learning is an exciting new aspect of computing. If data science aims to turn humans into computers, deep learning aims to turn computers back into humans. Check out my blog post here where I used deep learning to mimic the writing of scripture verses. Our class held a poster session filled with incredibly creative applications of deep learning.
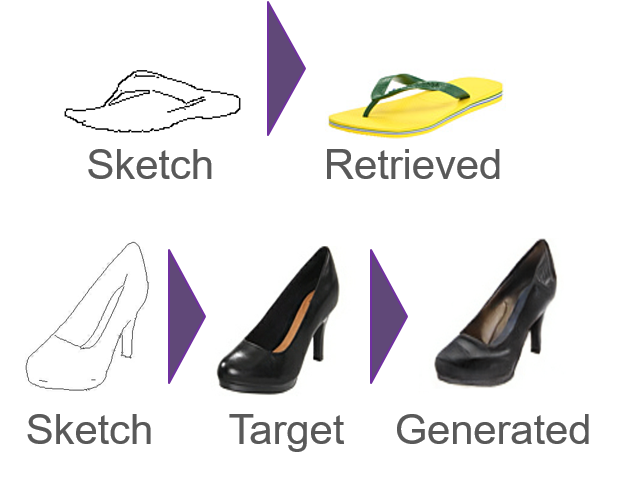
My team decided to use deep learning techniques to enable web retail shops (specifically shoe retailers) other ways of wowing customers through website features. The first feature would allow shoppers to sketch an image and match to the closest product. The second feature would generate realistic shoe designs based on a human drawn sketch.
Using a publically available database of shoe images from Zappos.com, we trained a model on artificially generated sketches. Our deep learning algorithm built in Python used Google’s brand new TensorFlow backend. After tuning all the parameters, our algorithm was able to create realistic looking final products as well as retrieve images with 80% accuracy.
Chicago Crime
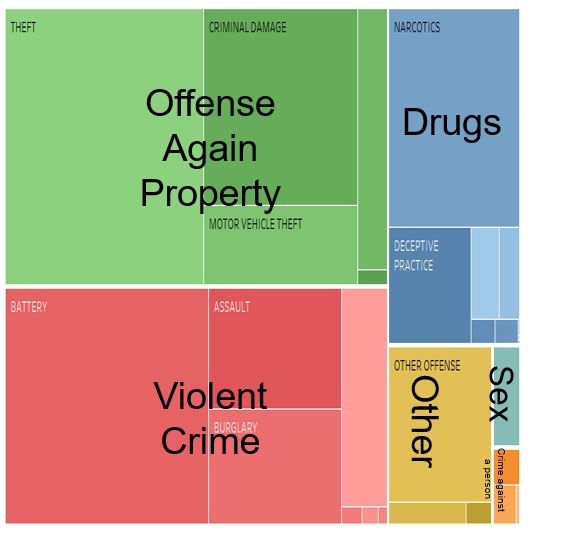
One of my most anticipated courses was Data Visualization. In addition to workshops in D3.js and Tableau, we studied the science of communicating data through visualization. I loved learning about the channels, methods and attributes of masterful design. We analyzed a number of higher order data visualizations such as Sankey diagrams, network graphs, tree maps (left) and cartograms.
Chicago has a reputation for crime and my team decided to use visualization to explore the truth. Crime data has temporal, geo-spatial and mathematical dimensions which we analyzed using R, Tableau and PowerPoint. We produced several graphics outlining our methods and compiled the results into a smooth story. One of our key insights was a spike in the lag between a crime happening and a crime being reported. Most crimes are reported within a few days of the event, but drug crimes saw unusual spike at 6 months. This may have something to do with a statute of limitation.
Predicting Lending Club Loans
Lending Club has been hailed as a disruptor of the traditional personal lending space by using a peer-to-peer model to reduce costs. Data about the past and current loans is publically available and used by lending investors.
Like any lending organization, minimizing defaults is critical. However, using advanced predictive techniques, we approached the problem from a different angle – maximizing return on investment (ROI).
We rigorously cleaned the data and followed best practices to methodically model ROI. Comparing the explanatory power of advanced statistical techniques including neural nets, boosted trees, support vector machines with standard logistic regression.
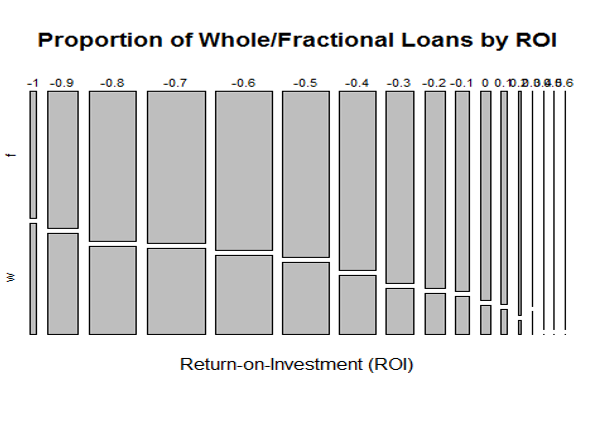
Institutional investors like the ability to lend the “whole” amount to the borrower. This contradicts Lending Clubs initial multiple-lender model, but the company eventually began allowing it. However, we found this practice to be counterproductive. It is better for lenders to lend “fractional” amounts from both a risk diversification and ROI standpoint.
Clustering NBA Players
STATS is the premier sports data collector and analyzer, holding a near monopoly on professional sports leagues. Using advanced video capture, the company amasses data on every game played to be analyzed in-house or by individual teams.
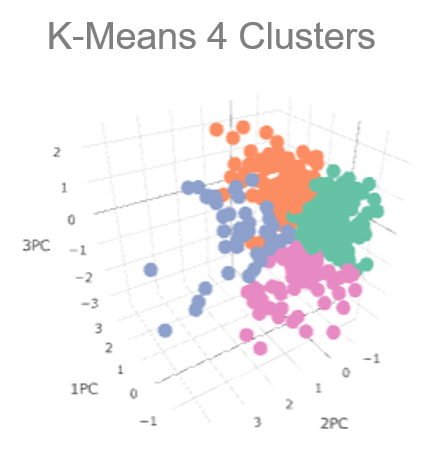
Working with NBA player data, we were tasked with data mining unique insights for either coaches or media commentators. Using R, we used factor analysis to boil down each player’s statistics to create 3-5 “mega-metrics.” We then used clustered the principal components to see the different groupings. As with any data mining task, we tried numerous clusters and components to get one that had value.
Our findings could be used in a television’s before-and-after commercial break quiz. We were able to see which players had the most similar playing style and statistics. For example, Q: Which player is most similar to LeBron James (in 2016) ? A: Kevin Durant (at Oklahoma City in 2016).
Text-based Recommendations

The administration staff were spending an exorbitant amount of time and energy responding to prospective student emails when the answers were covered on the program website. Using R, especially regular expressions (regex), we cleaned the raw Outlook data files and tested multiple methodologies aimed at saving the staff time responding to applicant emails. We experimented with using email keywords (a logic-based approach), and finding the closest similar email using Levenshtein and Cosine Distance. We classified 80% of emails into 17 categories. We found a trade-off between creating an accurate and scalable solution. The logic-based solution was extremely accurate, but the matching solution was more scalable. We matched 300 question emails to the corresponding answer that was used to provide an answer template. Our team even created a working desktop prototype.
Non-profit Donor Prioritization

A charitable organization wanted to maximize its mailer solicitation efforts. We needed to find the top 1,000 donors in terms of the likelihood to donate and the amount of predicted donation.
Using R, we performed a series of advanced predictive methodologies and tests. These included logistical regression to find reoccurring donors, and multiple linear regression to find how much they will donate.
Additionally, we performed tests to find outliers, significance tests on the variables and models, and other analysis to avoid multicollinearity and homoscedasticity.
The model we created estimated the top 1,000 donors would donate about $10,000. Our model slightly underestimated actual donations. Most importantly, each variable in our model had real-world business justification. We introduced new measures the client had not considered including donor cadence and donation slope.
Optimization
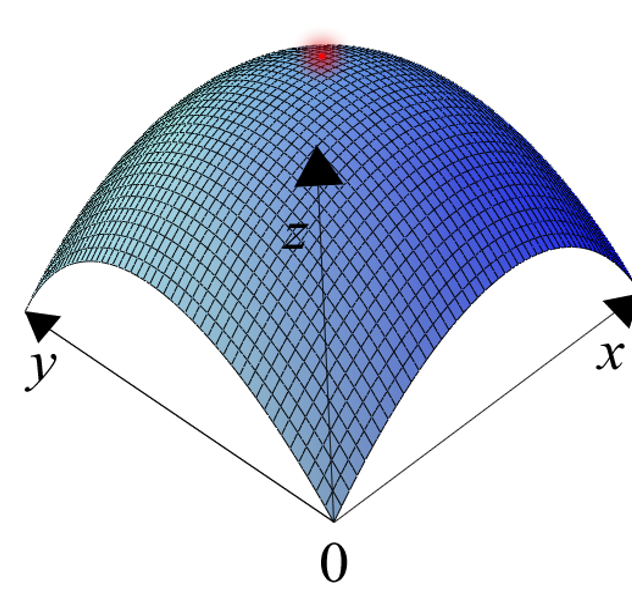
Optimization is a core element of prescriptive analytics. Throughout the class we were exposed to a number of common optimization problems including:
- Scheduling staff shifts
- Warehouse placement
- Ordering jobs on a line
- Revenue management (saving plane seats for higher prices)
- Multiple machines and products
- Blending products
- Route optimization (travelling salesman)
We utilized linear programming, integer programming, and heuristics in this very interactive and applied course. Integrating the CPLEX solver engine in OPL, but we also experimented with IBM products, R and Python. Less scalable models were ran using Excel’s built-in solver and an add-on Open-Solver.